


THE CURRENT ENVIRONMENT
As we stand today, we’re not officially in a recession as the National Bureau of Economic Research (NBER) hasn’t made That determination. But, are we heading in that direction? A number of indicators are starting to flash a warning sign. In general, many economists monitor indicators such as the Composite of Leading Indicators (CLI), jobless claims, and ISM new orders to determine where the economy may be headed. Of all the recession indicators, the 10-2 year U.S. Treasury yield spread (the difference between the 10-year UST rate and the 2-year UST rate) seems to be one of the more reliable indicators. A negative 10-2 year yield spread (the 10- year UST rate is lower than the 2-year UST rate) has historically been viewed as a precursor to a recession – this is known as an inverted yield curve. An inverted yield curve has accurately predicted the ten most recent recessions.
Where are we today? As the chart below shows, since the beginning of July 2022, the 10-2 year yield spread has been negative (a yield curve inversion). It’s likely that there will be a recession at some point (yield curve inversions have historically preceded recessions by 6 to 24 months).
10-2 Year Treasury Yield Spread
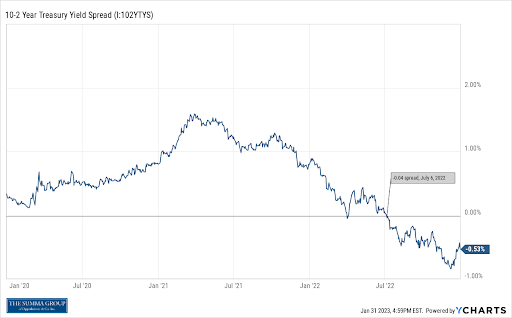
Time period: 1/1/2020 – 12/31/2022. Source: YCharts.
DRAWING A COMPARISON: THE EARLY 1980S VS. TODAY
Although no two recessions are identical, the Double-Dip Recession of the early 1980s (July 1981 to November 1982) most resembles the current environment we are in.
ENVIRONMENTAL FACTORS
Both periods saw inflation spiking.
- In the early 1980s, going back to the post-WWII era when the U.S. government went on a campaign to promote maximum employment, production, and purchasing power through fiscal and monetary efforts, which led to a spike in inflation—exacerbated by the commodity and oil shortages.
- Currently, due to the COVID-19 pandemic and the subsequent economic disruptions, an unprecedented amount of fiscal and monetary stimulus was poured into the economy, which translated into the subsequent strong labor market and housing booms and, in turn, to a spike in inflation. Supply chain issues and the war in Ukraine have only exacerbated the problem.
Both periods saw interest rates rising.
- In the early 1980s, the Fed’s timid interest rates hikes in 1980 weren’t enough to slow inflation, so Fed Chair Paul Volcker pushed interest rates to new heights—21.5% in 1982. The sky-high rate ultimately pulled inflation down, but took its toll on the economy, which shrunk by 3.6% during the 16-month recession.
- Currently, to tame inflation, the Fed hiked the Fed funds rate very aggressively in 2022. Although the absolute level of 4.5% is nowhere near what it got to back in the early 1980s, the speed and the magnitude at which the Fed has acted is unprecedented (the Fed funds rate basically went from 0.25% to 4.5% in just nine months!) and the Fed is not done yet. Therefore, the risk of a recession has continued to rise.
There are a few key differences between the two periods, however.
- The labor market is in a very different starting place, with the unemployment level much lower today. The current labor market is very tight by historical standards.
- In the early 1980s, peak inflation occurred almost two years after the initial acceleration began in the late 1970s, whereas inflation today came on more quickly.
- In the early 1980s, Fed funds rate and inflation started much higher and reached much more extreme levels than we’ve seen this time, at least up until now.
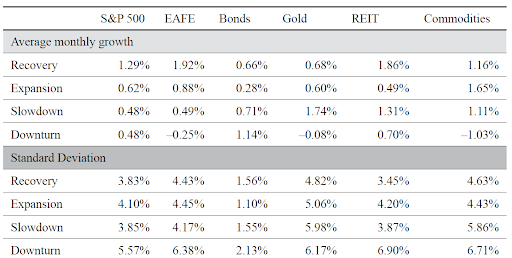
ASSET-CLASS PERFORMANCE
During the recession of the early 1980s, bonds were the best-performing asset class, followed by REITs. On the other hand, equities and commodities underperformed. Growth stocks underperformed value stocks.
Gold was the worst performer during the downturn phase, driven by falling inflation and specific macro events in the precious metals market. Now, does this translate to what is happening today? Using the same methodology as before, let’s take a look at the asset class performance in today’s environment.
TABLE 1. TODAY’S ECONOMIC ENVIRONMENT
| Phase | U.S. Equity | U.S. Growth | U.S. Value | Intl. Equity | Bonds | Gold | REITs | Commodities |
| Slowdown 5/1/21–3/31/22 |
9.79 | 7.65 | 7.37 | -1.79 | -4.90 | 9.79 | 14.30 | 52.04 |
| Downturn 4/1/22–12/31/22 |
-14.16 | -22.09 | -6.85 | -9.07 | -7.52 | -6.88 | -20.78 | -5.36 |
| Returns (%) annualized for each phase. Data via Morningstar. Asset-class indices defined in Appendix 2. | ||||||||
So far, the results of the current cycle follow the general trends of recessionary periods, but are somewhat different nevertheless.
- The most significant outlier is that bonds—the only asset class that has produced positive returns in past recessions—had a negative return in both the slowdown and downturn phases of the recent economy. Bonds’ uncharacteristic drawdown in the slowed economy is due to the rising rate environment as the Fed tightened aggressively to combat inflation.
- REITs were the worst-performing asset class during the recent downturn phase as the asset class is negatively affected by spikes in interest rates and equity market volatility, both of which have been prominent factors in the recent phases of the current cycle. Conversely, REITs performed well in the downturn phase of the 1980s.
- Surprisingly, gold did not do well in the recent downturn phase despite the inflationary environment and high geopolitical tension, both of which should have been tailwinds for gold. Rising rates and a strong U.S. dollar had a significant negative effect on gold prices. Similarly to the 1980s, gold has been on its own unpredictable trajectory.
- Commodities, unlike the 1980s and previous recessionary periods, is the only asset class that has a positive return when combining these two recent periods. The spike in oil prices in early 2022 contributed to this and the war between Russia and Ukraine sent agriculture prices to multiyear highs. Furthermore, industry consolidation of energy companies, tight energy supplies, and the reopening of China provided additional tailwinds for the space.
- Equity performance in the recent drawdown is comparable to the 1980s and recessionary periods in general in that the asset class did not perform well.
The current downturn phase certainly has yet to come to an end as recession fears continue to be investors’ top concerns going into 2023. Although we can draw comparisons between the 1980s and now, we are already seeing discrepancies in the performance trends of asset classes—further validating the thesis that no two recessionary environments are the same.
HOW CAN INVESTORS PREPARE FOR A RECESSION?
Our findings throughout this series have illustrated that the general idea still holds true: Risky assets outperform during economic recoveries, whereas bonds outperform during recessions. However, as we’ve gleaned from the results of our research, timing these cycles is an impossible feat. The old adage rings true: “The best offense is a great defense.” Diversification serves as a risk-mitigation tool and may enhance the overall returns of the portfolio across full economic cycles. Diversified portfolios can provide stability and unique opportunities for growth.
FINAL THOUGHTS
After providing a historical perspective on notable recessionary periods of the past century, it is evident that investors must be careful in relying too heavily on previous trends. In reality, we must understand picking a perfect NCAA Men’s College basketball bracket is as difficult as predicting the severity, length, and best investment ideas before, during, and after any recessionary period.
Our objective in the composition of this whitepaper is to dispel the notion that recessions are destructive and are periods of time whereby investors can’t find high quality investment opportunities. What we have learned is that the capital markets don’t wait for recessionary periods to begin. In fact, the markets typically act as a leading indicator, making positive upward moves six months prior to the end of a recession. This “discounting” mechanism is nothing new. As the analyst community initiates buy ratings on stocks, the price has already moved in advance of this “news.” The adage, “buy the rumor, sell the news,” rings true not only with individual stocks but with sectors and countries- and certainly with recessions.
Markets don’t wait for the “green” light to go on, which validates the risks of market timing. Given the seemingly endless list of market forces in play every minute of every day, it’s impossible to figure out perfect points in and out of the capital markets, or recessions for that matter. Even for the most battle tested market traders, having conviction with regard to where markets are heading next can be a very challenging endeavor.
For the Summa Group and other leading wealth management teams, the end game is all about surviving to live another day so client capital stays intact and can fully participate as markets stabilize and regain a sense of normalcy.
As of this writing, the opinions of some very wise fund managers, economists, investment strategists, and others who make a living by having opinions, are all over the place when it comes to their predictions about deflation, inflation, recession, no recession, etc.
The bottom line is don’t put yourself in harm’s way with even your highest levels of conviction because a lot of things have to go right. Instead, put yourself in a position to benefit from multiple scenarios playing out while maintaining liquidity, balance, and diversification.
Read Part I here. Read Part II here.
APPENDIX
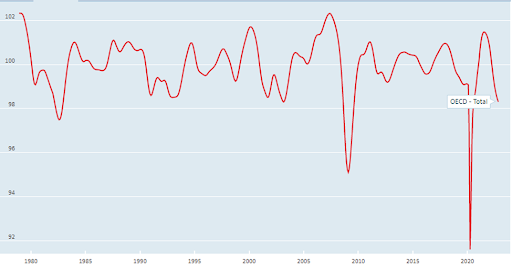
CLI (Composite Leading Indicators): It is an aggregate time series, which shows a leading relationship with
the growth cycles of key macroeconomic indicators, with an average lead of six months. The leading indicator
approach is the best way to predict phases of economic cycles. Typically, they are constructed to predict the
cycle of total industrial production, which is a proxy for the aggregate economy.
The below chart shows the overall CLI trend during this period. It does a pretty good job of forecasting the
economic activities.
“Analysis of Asset Classes through the Business Cycle”, Audius Dzikevicius and Jaroslav Vetrov
Asset class index definitions:
- “U.S. Equity” represented by the S&P 500 Index
- “U.S. Value” represented by Russell 1000 Value Index
- “U.S. Growth” represented by Russell 1000 Growth Index
- “International Equity” represented by MSCI EAFE Index
- “Bonds” represented by Bloomberg US Agg Bond Index
- “Gold” represented by S&P GSCI Gold Index
- “Real Estate” represented by FTSE Nareit All Equity REITs Index
- “Commodities” represented by S&P GSCI Index
Sector Performance During Past Recessions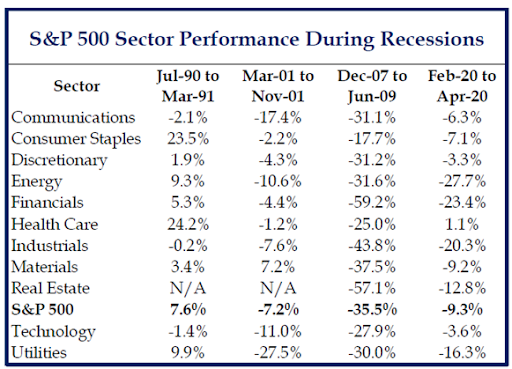
In looking at the sector performance of the market during recessions, it is difficult to discern strong patterns.
Among these past 4 recessions, the recessions in 1990 and 2001 were mild. The recession associated with the
pandemic in 2020 was remarkably short. The only deep recession was the Global Financial Crisis in 2008.
Perhaps the greatest lesson that can be gleaned for investors is this: the deeper the recession and
corresponding bear market, the fewer places investors can find to hide. Defensives outperform cyclicals.
SOURCES
- “Analysis of Asset Classes Through The Business Cycle” by Audrius Dzikevicius and Jaroslav Vetrov
- Strategas Investment Strategy Report; October 31, 2022; Strategas Securities, LLC. (sector performance
during past four recessions) - What The Heck Is An Inverted Yield Curve? And Why Does It Predict A Recession? (forbes.com)
- BNY Mellon on Potential Recession (B. Jones, personal communication, December 9, 2022)
- DWS on Potential Recession (T. Monks, personal communication, December 12, 2022)
DISCLOSURES
The foregoing is not and is under no circumstances to be construed as an offer to sell or buy any securities. The information set
forth herein has been derived from sources believed to be reliable but is not guaranteed as to accuracy and does not purport to be
a complete statement of all material facts relating to the security or strategies discussed. The opinions of the author expressed
herein are subject to change without notice and do not necessarily reflect those of the Firm. Additional information is available
upon request. Oppenheimer & Co. Inc. does not provide legal or tax advice. Investing in securities is speculative and entails risk,
including potential loss of principal. Investors should review potential investments with their financial advisor for the
appropriateness of that investment with their investment objectives, risk tolerances and financial circumstances.
Oppenheimer & Co. Inc. Transacts Business on all Principal Exchanges and Member SIPC
Brian Werdesheim is a founding member of The Summa Group of Oppenheimer & Co. Inc (“Oppenheimer”), a private client financial advisory team that provides wealth management services.
Contributors from the Summa Group to the content of this article:
Brian Werdesheim
Stan Yang, CFA
Savannah Pincus
Valerie Yang, CFP